The Spanish version is the authoritative reference. View in Spanish
🏠 Home
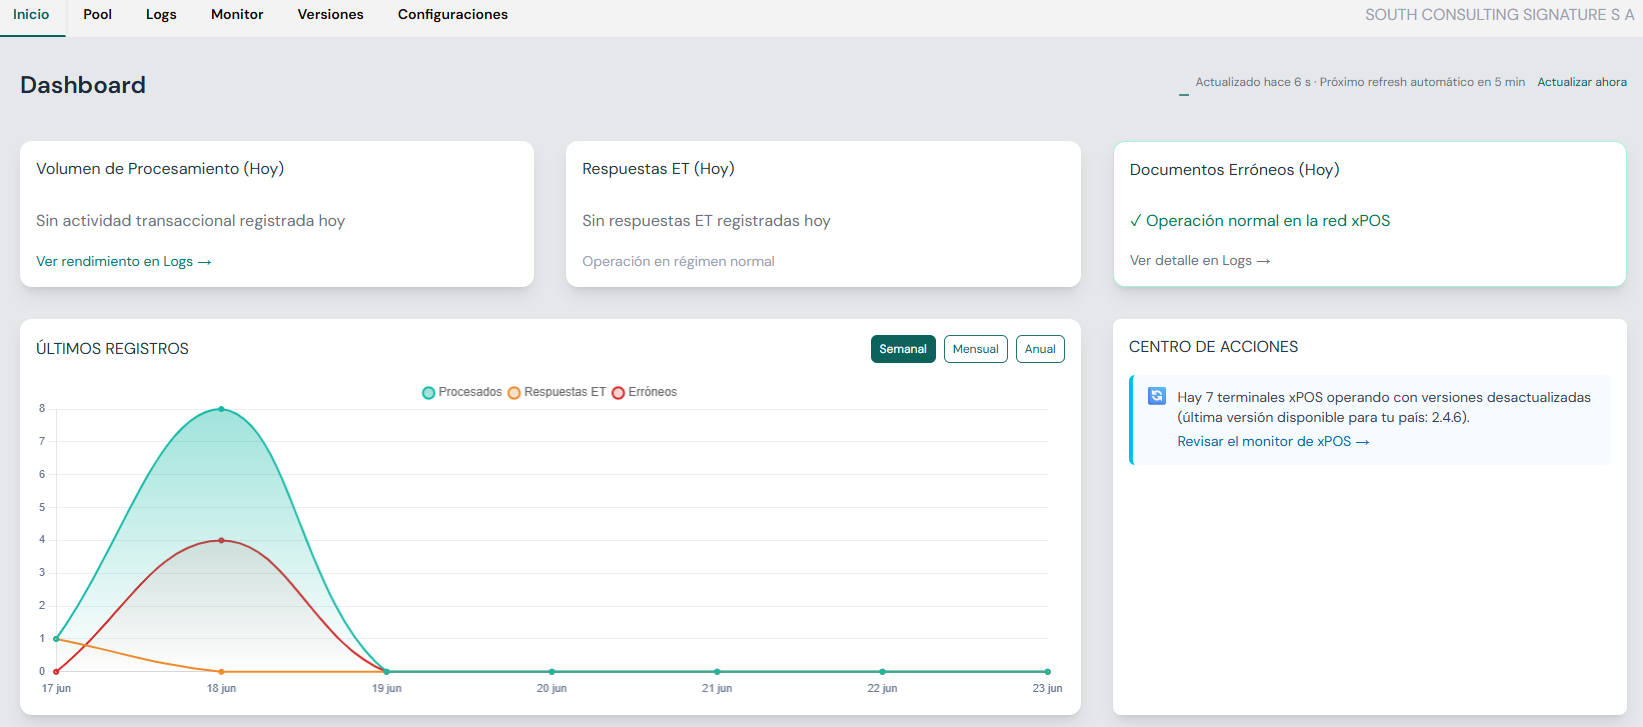
The main page (Home) offers a visual summary of the current state of your xPOS ecosystem:
- Key performance indicators: number of documents processed during the day, with errors or in contingency mode.
- Recent activity panel: a bar chart showing the evolution of processed documents, errors and ET/contingency responses, with the option to filter by week, month or year.
- Shortcuts to sections such as Monitor, Logs and Settings.
- Automatic data refresh every 5 minutes.
✅ Usage recommendations
- Review the panel at the start of the day to check for errors or delays in document processing.
- If there are failed documents, check the Logs section or contact the support team.
- Use the filters (weekly, monthly, yearly) to track performance and document volume.