The Spanish version is the authoritative reference. View in Spanish
🧾 Logs
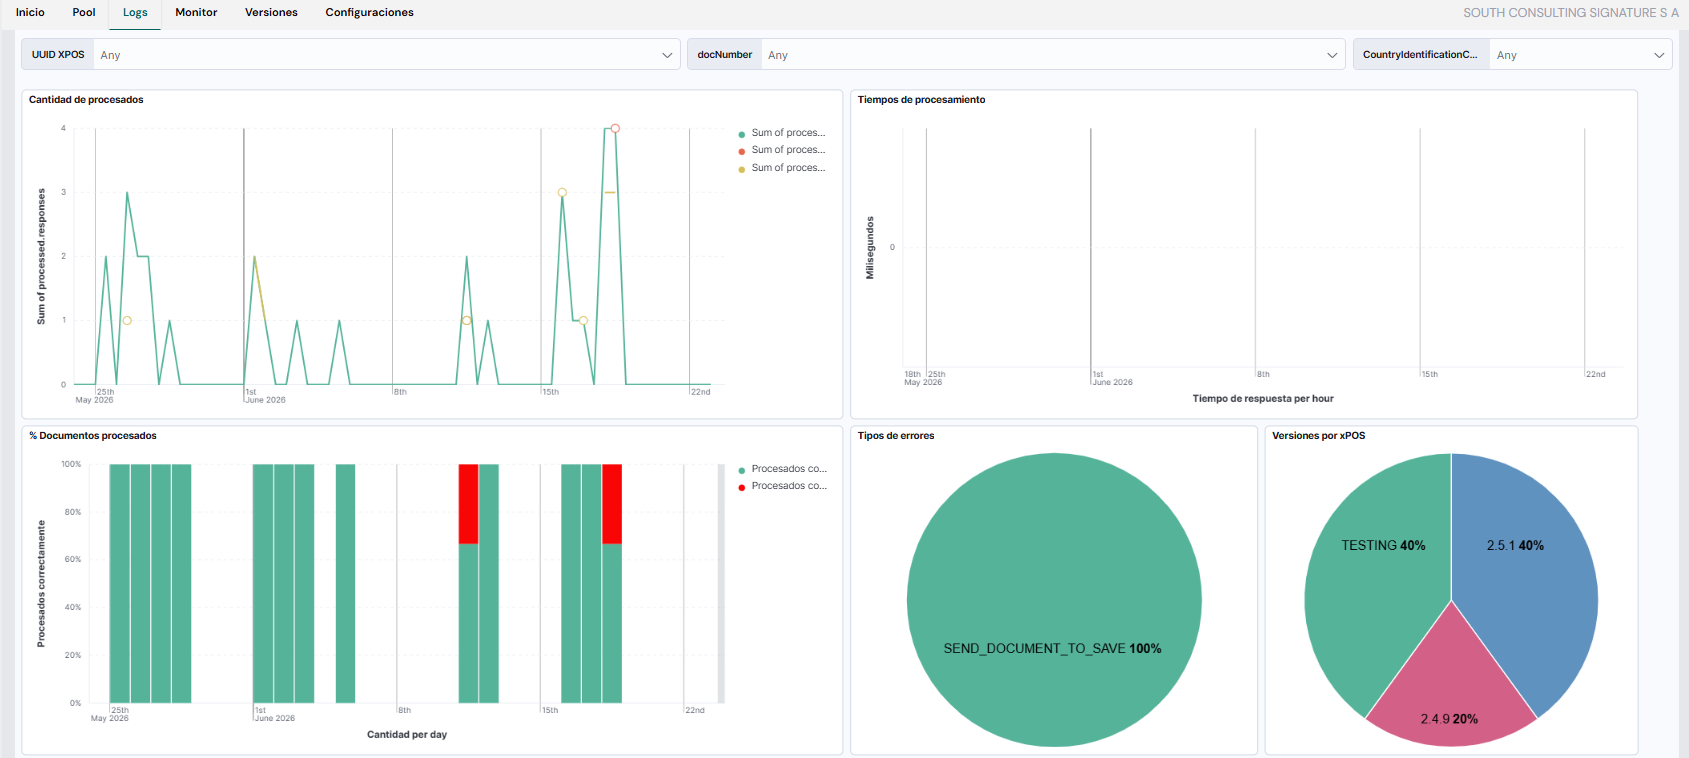
The Logs section provides a near real-time visualization of system behavior through interactive charts. It is a fundamental tool for operational monitoring, technical support and performance analysis.
🔐 Accessing the section
From the xPOS Gadget main menu, select the Logs option to enter the visualization panel. There you will find filters and graphical representations of the system state.
🎛 Visualization filters
At the top of the panel you will find the filter bar and visualization controls:
- Time selector: defines the analysis period, for example "Last 2 days" or custom ranges.
- Refresh button (🔄): reloads the data to show the latest available information.
- View controls: icons or buttons that adjust the chart type, data density or visualization styles.
Available search fields:
- xPOS UUID: ID of the specific xPOS to query.
- docNumber: fiscal series and number of the document.
- TransactionID: transaction ID of the document generated in xPOS.
- ET_CODE: authorization number from the tax authority (CUFE, authorization number, etc.).
note
The data in this section is indexed continuously and displayed in near real time, ideal for immediate diagnostics.
✅ Best practices
- Monitor the section daily to check the system state.
- Watch for error spikes or interruptions in the normal processing flow.
- Adjust the time filters to focus your analysis on critical periods (for example, peak-demand hours).
If you detect anomalous behavior or recurring errors:
- Export the data (if the feature is available).
- Report it to the technical support team for review.